Reports
The Reports tab shows a list of all PowerBI Reports uploaded against the site.
Report card
When viewing the list of reports, they are presented as a suite of cards. These cards primarily access the report, but can perform several other functions:
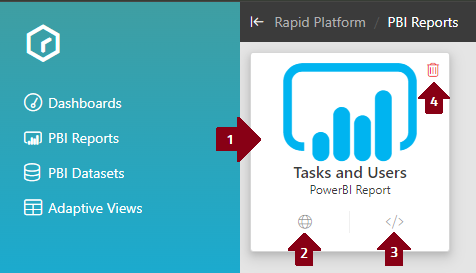
- Clicking the card body will navigate to the report
- Clicking the Web URL button will navigate to the reports location within PowerBI. This feature is only available for sites using their own PowerBI hosting.
- Clicking the Embed URL button will navigate to the embeddable version of the report. Right-clicking and copying link will generate a url that can be used in iFrames and other pages
- Clicking the trash can will delete the report from your sites workspace permanently.
Viewing and editing reports
After navigating to a report, you can toggle between View and Edit mode on the top command bar.
Viewing a report behaves the same as in Explorer. Reports are interactable like any other PowerBI instance.
Editing a report allows you to manipulate the visualizations and inspect the dataset beneath the report itself.
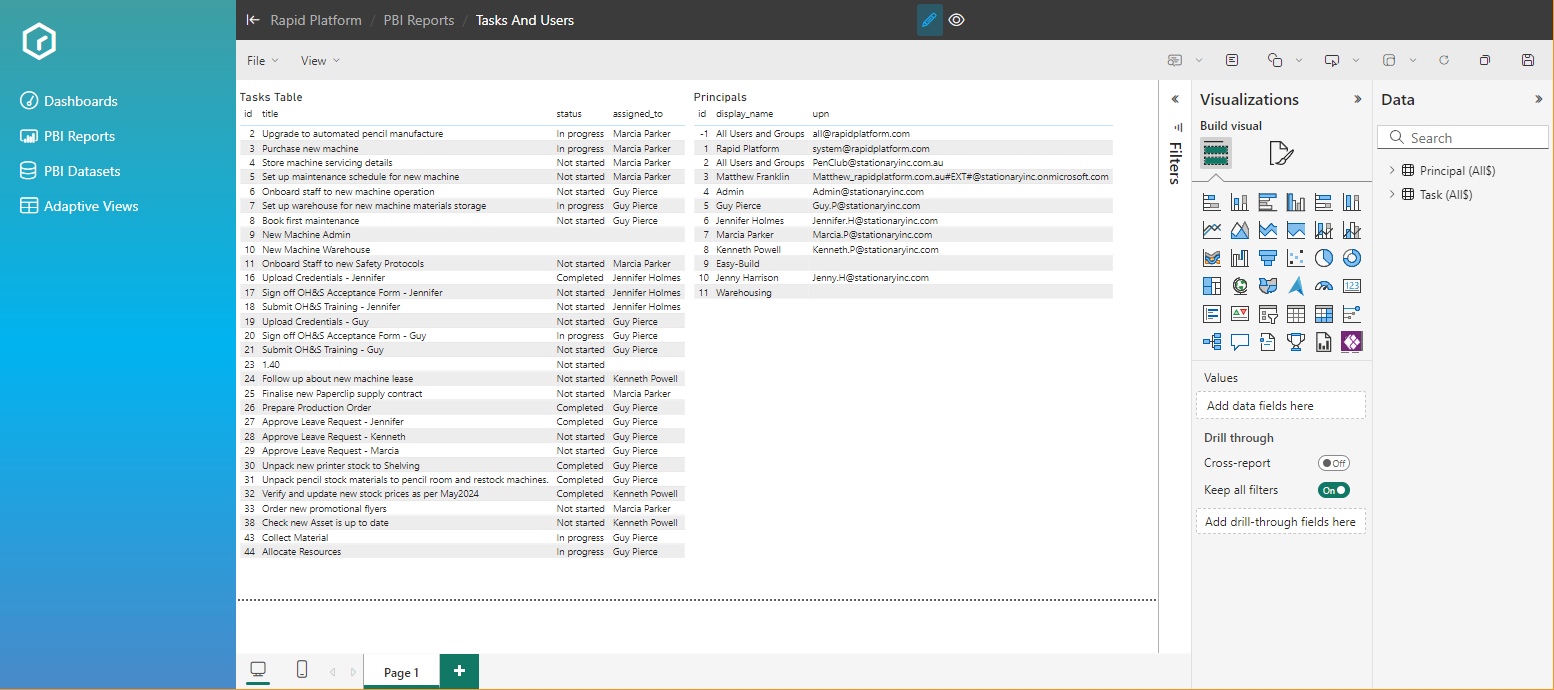
All standard PowerBI visuals are available, along with basic shapes. Edits made to your report can be saved, or new copies can be created as alternate views of the same dataset.
Datasets
Datasets are the connected source of data that sits below a report. All reports need at least one dataset so they have something to show. A single dataset though can have multiple different reports built off of it, showcasing different views and perspectives of the data.
When you upload a report to your site workspace, it uploads the dataset built into the PowerBI file as well.
Creating a report from a dataset
On the PBI Reports tab you can create a new report from an existing dataset. This will select the dataset and put the new blank report in edit mode so you can create the visuals. New reports created this way are temporary until saved.
Viewing datasets
On the PBI Datasets tab you can view all the datasets uploaded against your site Workspace.
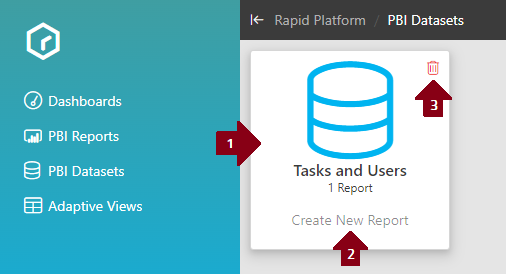
- Clicking on the card will navigate to the Dataset details page
- Clicking 'Create New Report' will navigate to a blank report in edit mode with the dataset selected
- Clicking the trash can will permanently delete the dataset. This will not remove the associated PowerBI reports.
Editing datasets
A dataset from your Rapid site is composed of a set of tables, and optional relationships between them. Your site can change and grow with your business, but datasets are intentionally static so as to not break existing Reports. Here on the dataset view you can add and remove columns, either to winnow down to just what your report requires or to add fresh new columns as your site expands.
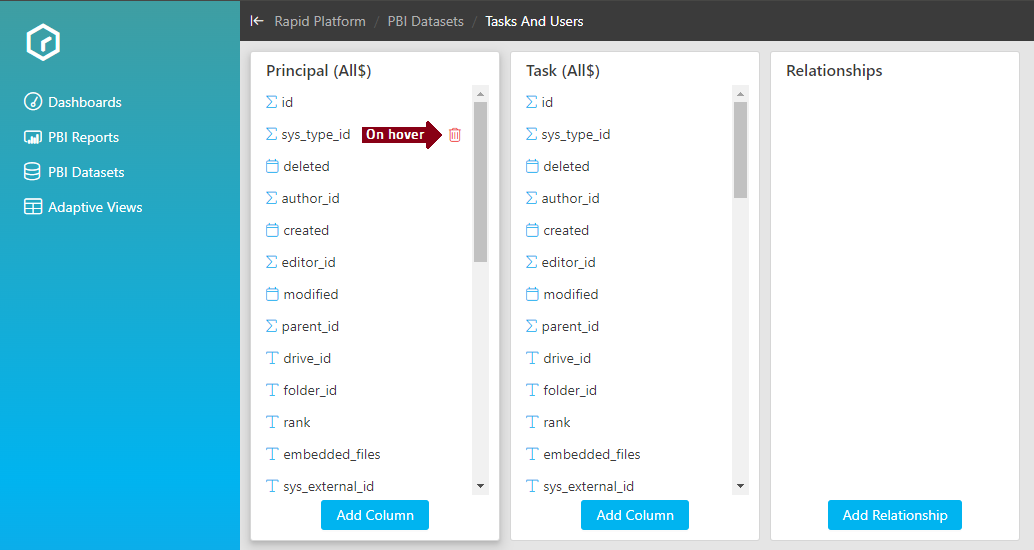
Relationships between tables control how items show up contextually in visuals. This is the same as the Data Model configuration in Desktop PowerBI.
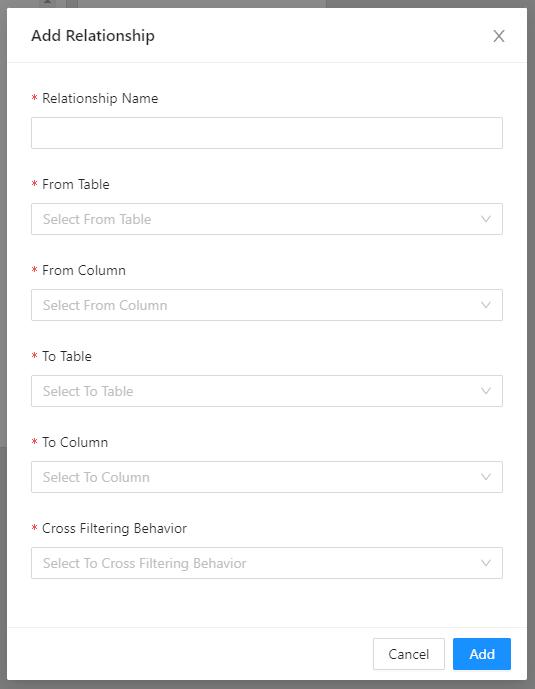
When constructing a relationship, there are several things to consider:
- Relationship Name : Having a useful name helps when you have many relationships to identify which is which
- From Table : Which table corresponds to the source data in the relationship. For directional relationships this is the child of the relationship.
- From Column : Which column we are regarding on the From Table that will power the relationship
- To Table : The other table for this relationship. For directional relationships this is the parent.
- To Column : Which column we are regarding on the To Table, very commonly this is an ID or some kind.
- Cross Filtering Behaviour : Relationships come in two flavours, directional and bi-directional. Choosing automatic will let PowerBI decide which one is most appropriate.
For example, if we wanted to create a relationship that associates tasks via the Assigned To column to Principals it would look like this:
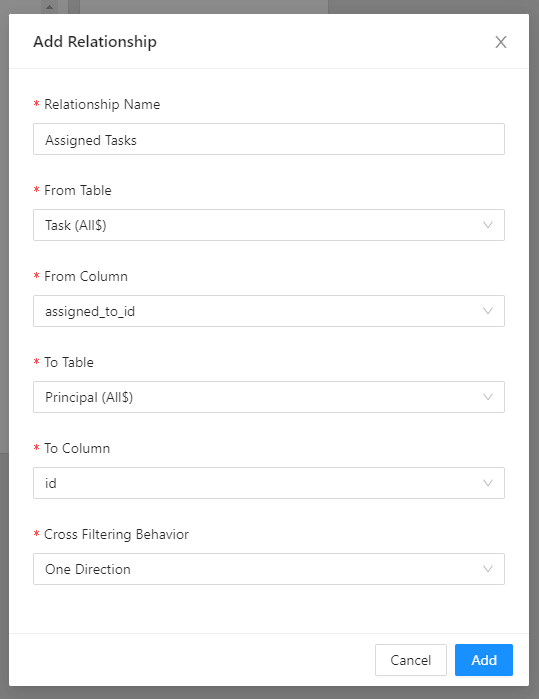
- Relationship Name :
Assigned Tasks - From Table :
Task (All$) - From Column :
assigned_to_id - To Table :
Principal (All$) - To Column :
id - Cross Filtering Behaviour :
One Direction
Now with the relationship set up, the select a Principal in the report will filter the tasks so that only ones assigned are displayed.
